Fraunhofer Institute for Integrated Circuits IIS
Micro Computed Tomography (µCT) designs scans with a measured spatial resolution (BSR, MTF or LSF) between 2 µm and 50 µm. Many µCT scanners are operated at Fraunhofer EZRT for materials characterization and/or for CT metrology. They all include micro-focal anodes, typically with variable high voltage and spot size. Scan times range between 1 min and 2 h are typical. Geometric magnification is adjusted continuously between 50x and 2x. Flatpanel detectors (FPDs) with pixel sizes between 50 µm and 200 µm are routinely used; some scanners comprise CCD detectors with even smaller pixels (e.g. 9 µm or 24 µm).
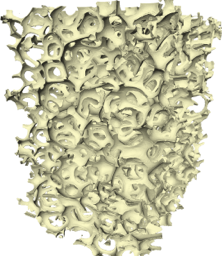
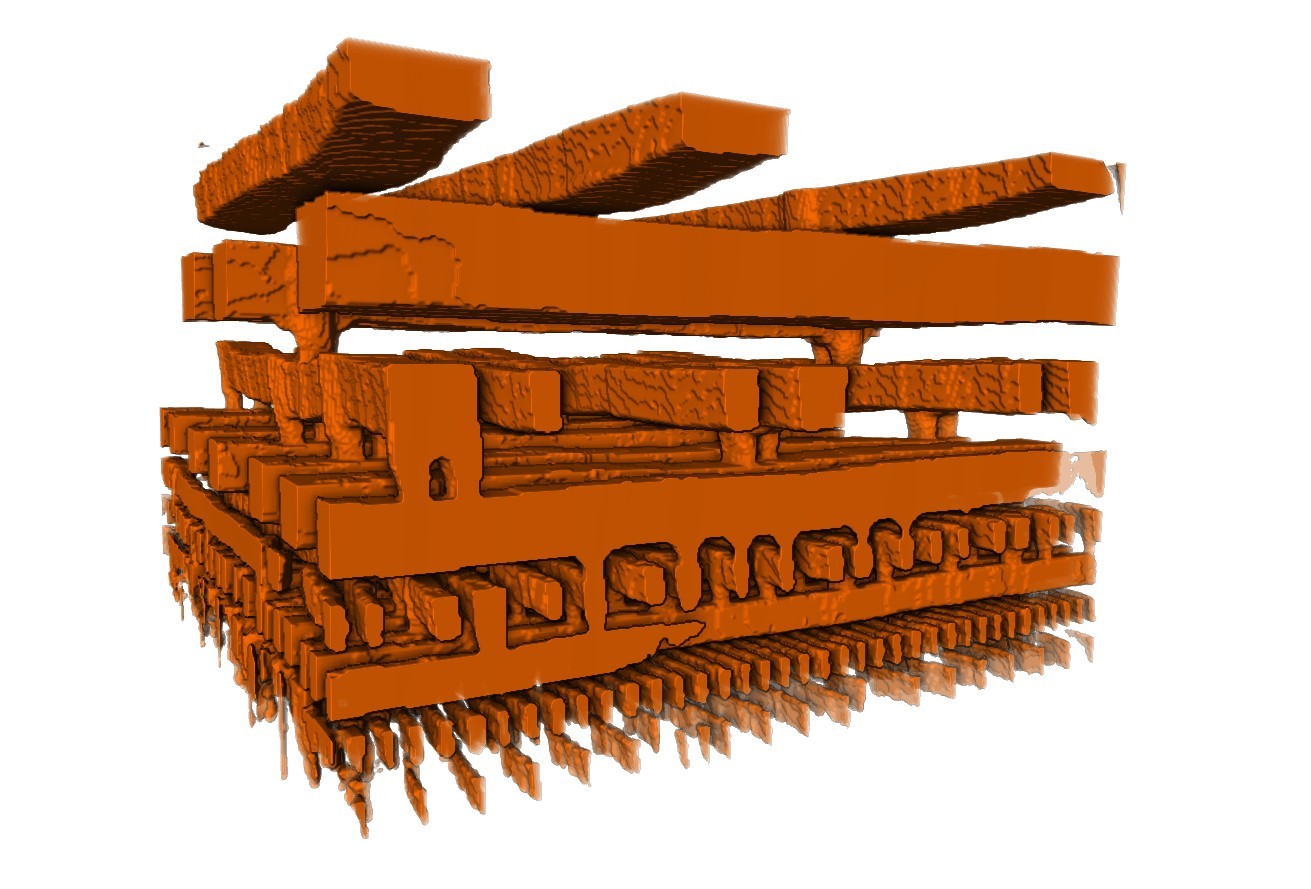
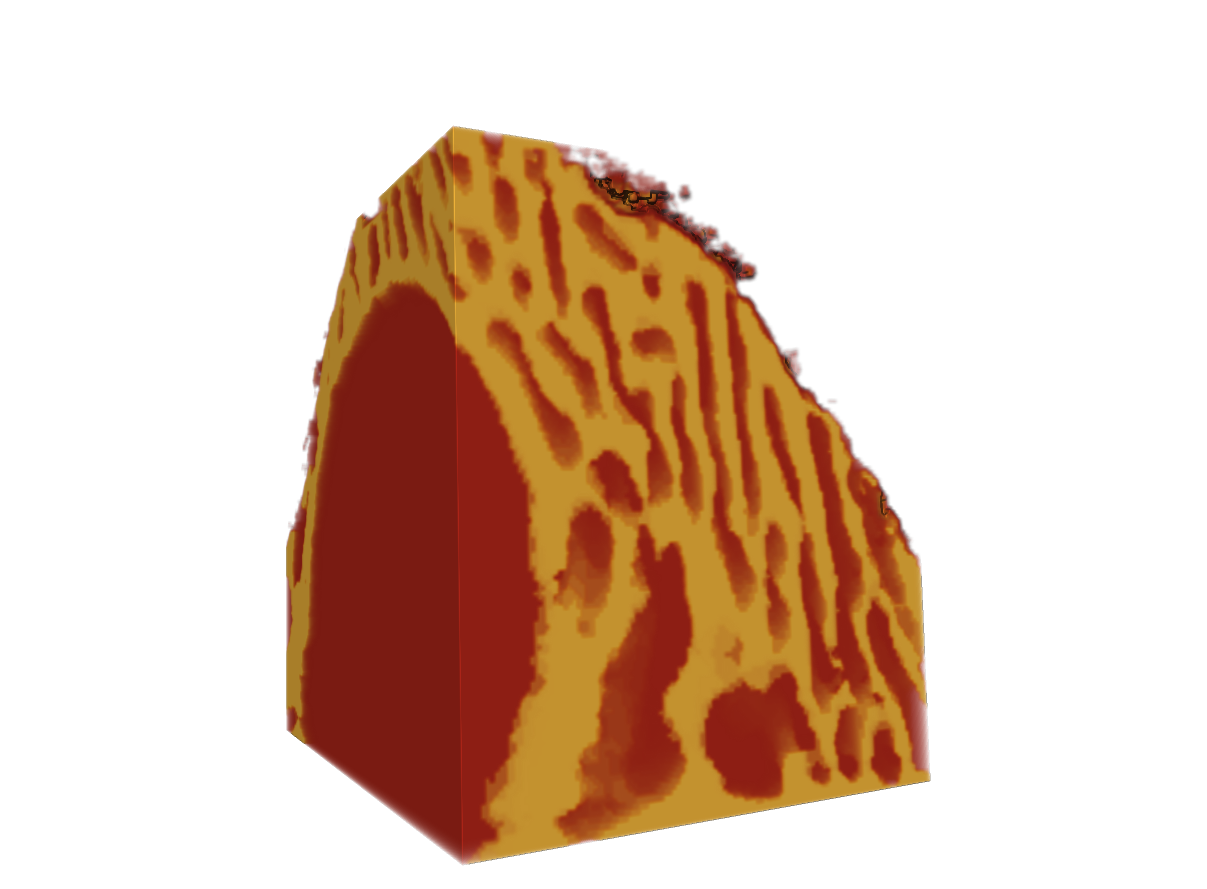
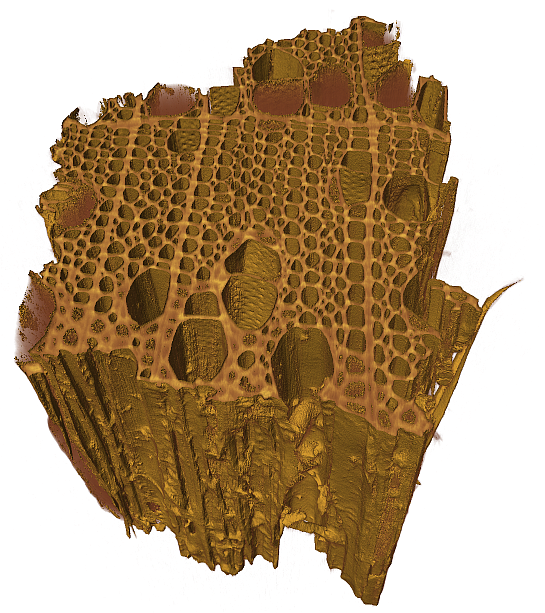
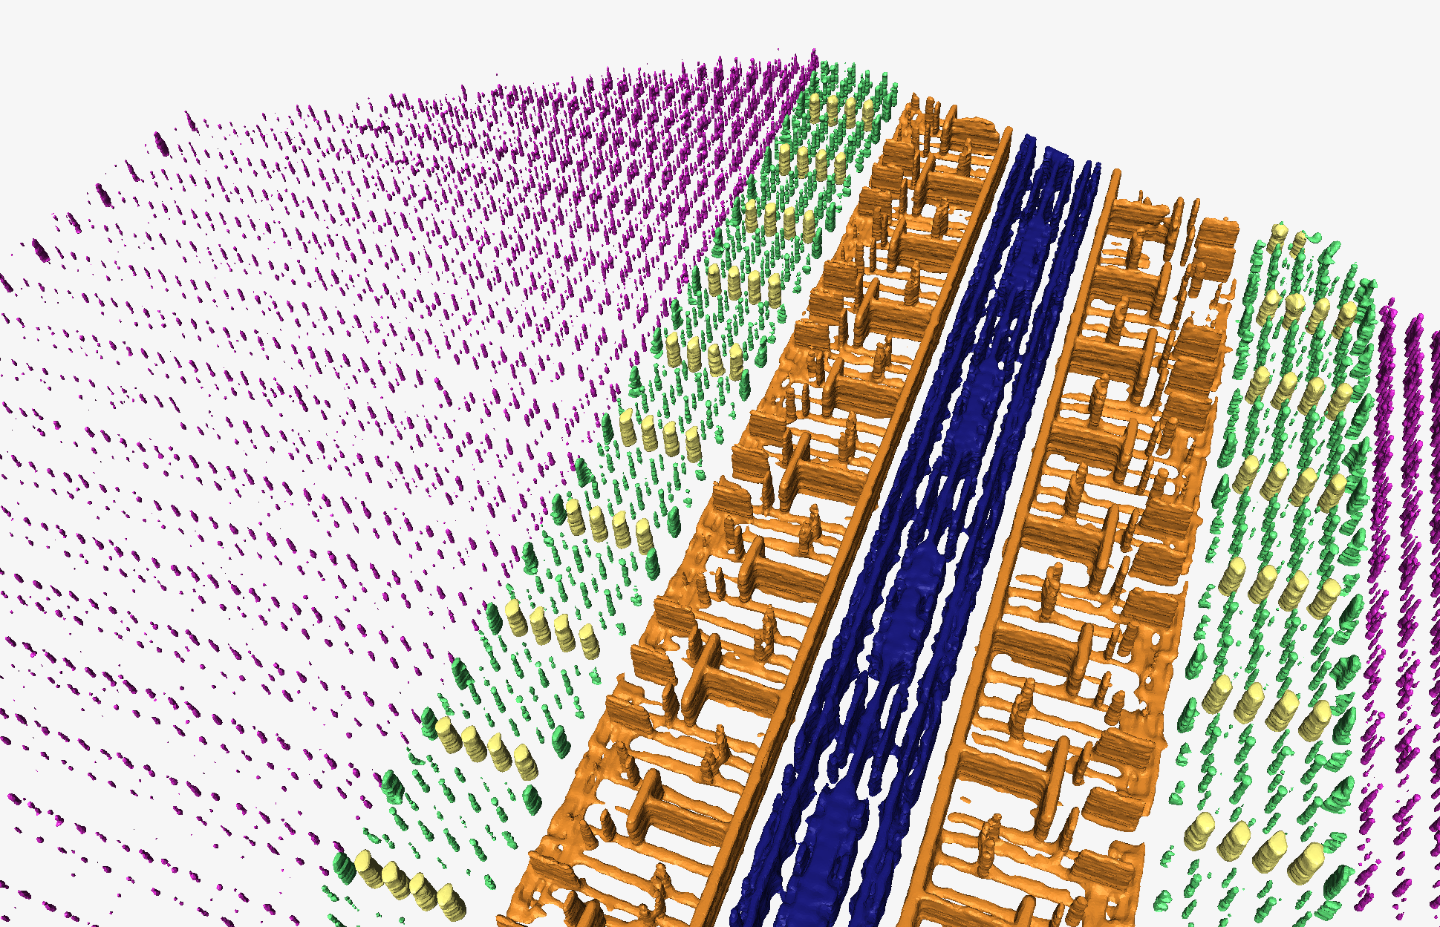
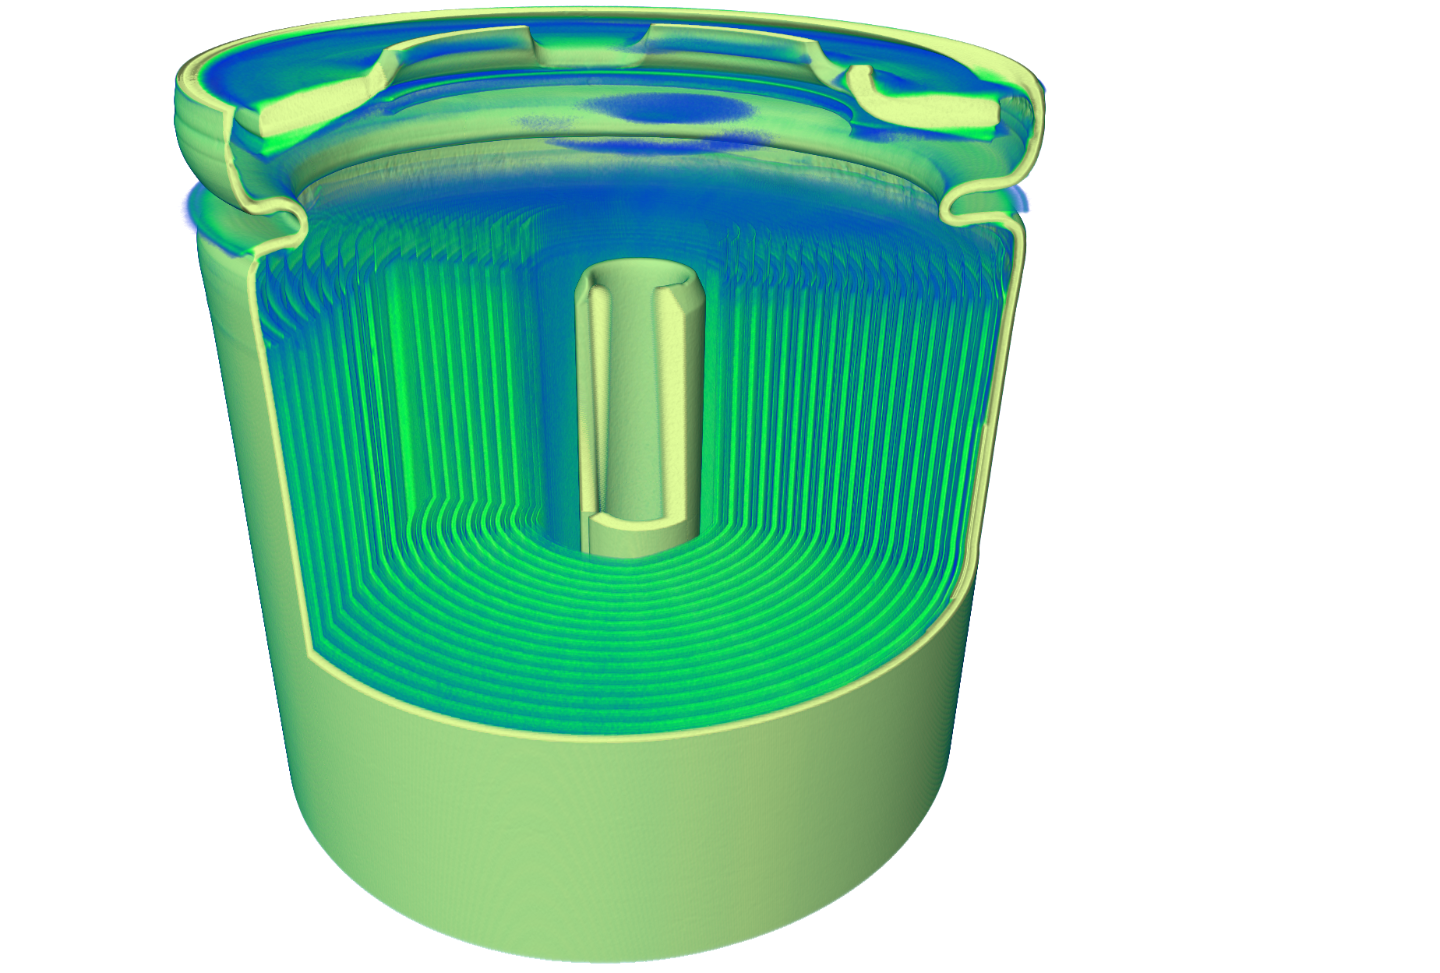
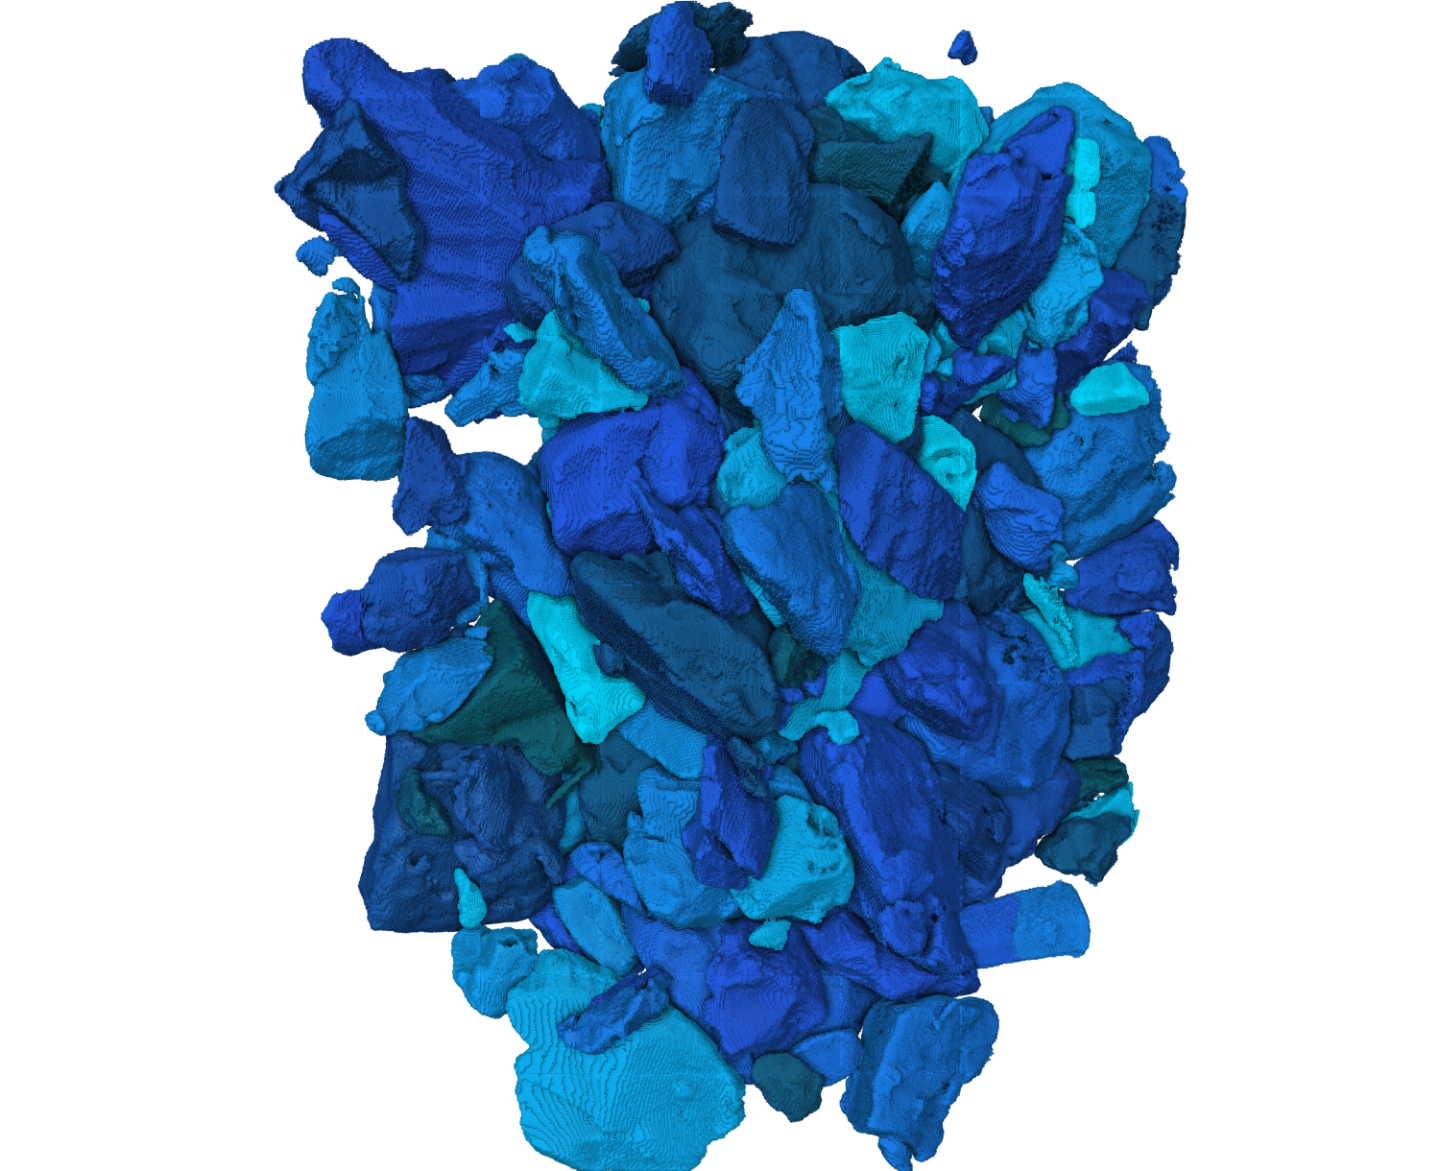
Micro- and Nano Computed Tomography
Sub-Micrometer Computed Tomography (subµ CT) designs scans with a measured spatial resolution between 0.3 µm and 3 µm. Fraunhofer EZRT operates a detector-based subµ CT scanner: The Click-CT prototype employs a microscope X-ray detector, which resolves 0.5 µm details while using a standard micro-focal anode. Typical scan times range between 3 h and 12 h.
Nano Computed Tomography (nanoCT) is capable of resolving details below 300 nm size. Fraunhofer EZRT employs the XRM-II prototype, as well as the ntCT. The latter realizes a focal spot size down to 150 nm at 60 kV (i.e. geometric magnification up to 1000x), whereas the former integrates nanoCT with 50 nm resolving power at 30 kV inside a scanning electron microscope (SEM). Geometric magnification is variable for both systems. The XRM-II comprises a variety of target sizes and materials (Cu, W, Ag, Mo) which can be changed quickly. Typical scan times are 3 h for the ntCT and 12 h for the XRM-II.
Scanner Classes
Because of the strongly different parameters and X-ray components, different scanners are developed to meet different needs.
Typical parameters for the three high-resolution CT scanner classes:
Scanner /Parameter |
µCT |
Subµ CT |
NanoCT |
Max. High Voltage /kV |
90 – 300 |
60 – 160 |
30 |
Emission Power /W |
1 – 1200 |
0.06 – 0.4 |
<0.01 |
Max. object size /mm |
250 |
2 – 5 |
0.06 |
Min. detail res. /µm |
2 – 50 |
0.3 – 3 |
0.03 – 0.3 |
Geom. Magnification |
2 – 50 |
25 – 250 (except for detector-based subµ) |
250 – 10000 |
Scan times /h |
0.01 – 3 |
3 – 12 |
8 – 16 |

Fig. Object size vs. detail resolution for the different scanner classes.